Fig. 4
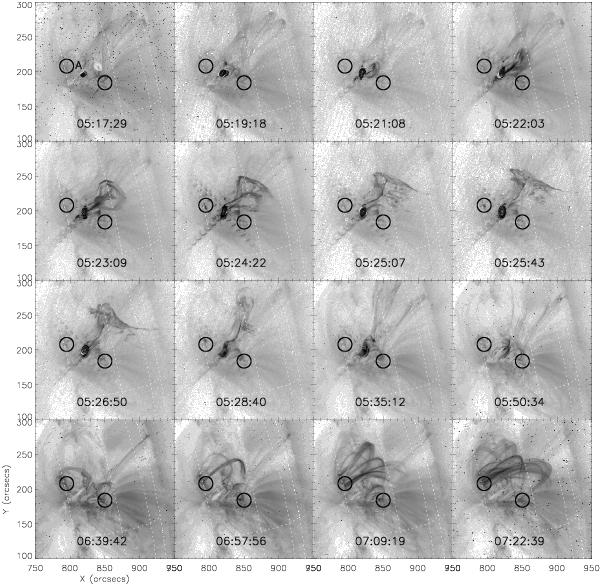
Set of 171 Å images taken from TRACE for different moments during the evolution of the SOL2004-07-14T05:23 event. The location of the brightening is circled in every image. In the top-left image the region is named. In selected images reconstructed HXR contours are marked for the RHESSI energy bands at 6–12 keV (white solid line) and at 25–50 keV (black solid line).See the electronic form for a color version of the plot and for a movie presenting the entire event.
Current usage metrics show cumulative count of Article Views (full-text article views including HTML views, PDF and ePub downloads, according to the available data) and Abstracts Views on Vision4Press platform.
Data correspond to usage on the plateform after 2015. The current usage metrics is available 48-96 hours after online publication and is updated daily on week days.
Initial download of the metrics may take a while.