Fig. 9
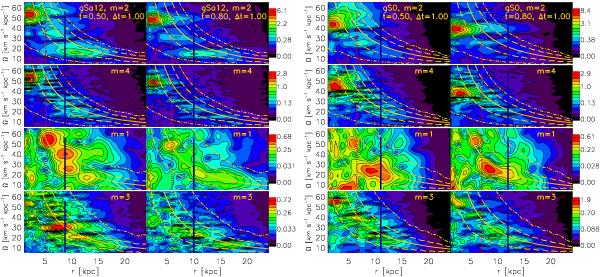
Power spectrograms (from top to bottom) of the m = 2,4,1 and 3 Fourier components for the gSa (Cols. 1, 2) and gS0 (Cols. 3, 4) models. Spectrograms are computed in a time window Δt = 1 Gyr centered on t = 0.5 and t = 0.8 Gyr. For m = 2 and m = 4, the resonance loci are plotted for the CR (solid), 4:1 LR (dashed) and 2:1 LR (dot-dashed) orange lines, computed as Ω, Ω ± κ/4, and Ω ± κ/2, respectively. For the m = 1 and m = 3 cases, we plot Ω, Ω ± κ, and Ω ± κ/3. Both bars and spirals are seen to slow down at later times. The dotter-red and solid-blue vertical lines show the radial location of the bar’s CR and OLR.
Current usage metrics show cumulative count of Article Views (full-text article views including HTML views, PDF and ePub downloads, according to the available data) and Abstracts Views on Vision4Press platform.
Data correspond to usage on the plateform after 2015. The current usage metrics is available 48-96 hours after online publication and is updated daily on week days.
Initial download of the metrics may take a while.