Fig. 8
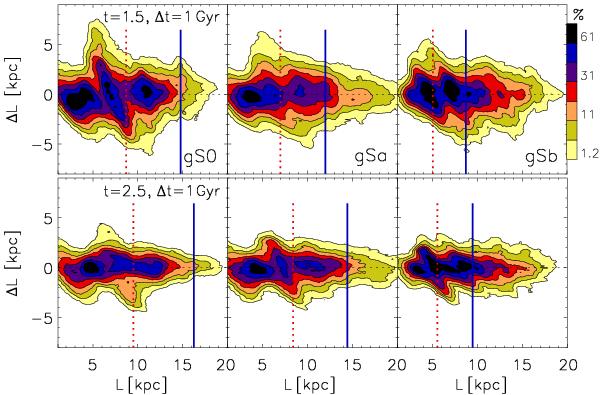
Changes in angular momentum in the time periods t = 1−2 Gyr (top) and t = 2−3 Gyr (bottom) for the gS0, gSa, and gSb models. The initial angular momentum L here corresponds to t = 1 and t = 2 Gyr, respectively. The time averaged value of the bar’s CR and 2:1 OLR are shown by the dotted-red and solid-blue lines. It is evident that the bars are the most effective drivers of radial migration through their CR, despite the fact that they are not transient, but only slowly evolving. This is true for the entirety of the simulations, as this figure shows.
Current usage metrics show cumulative count of Article Views (full-text article views including HTML views, PDF and ePub downloads, according to the available data) and Abstracts Views on Vision4Press platform.
Data correspond to usage on the plateform after 2015. The current usage metrics is available 48-96 hours after online publication and is updated daily on week days.
Initial download of the metrics may take a while.