Fig. 7
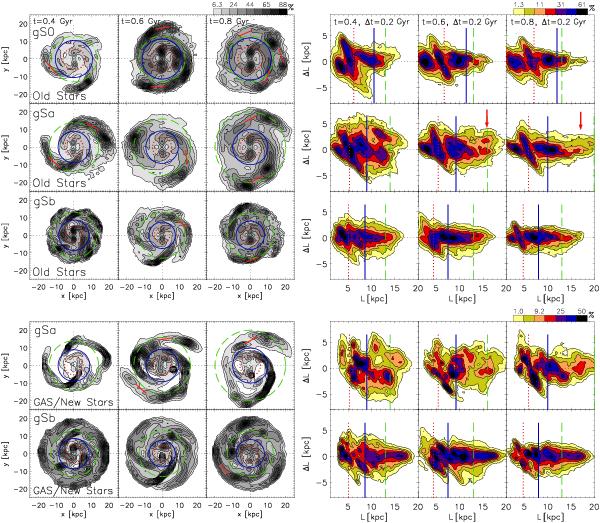
Columns 1–3: differential, face-on, density of the gS0, gSa and gSb discs, for three different times. The first three rows show the “old” stars, while the last two rows show hybrid particles. All bars are aligned with the vertical axis. Some of the spiral discontinuities are labeled by short, solid, red lines. Columns 4 − 6: incremental changes in angular momentum, ΔL, in time intervals of 200 Myr, centered on the time of the snapshots shown in the first three columns. Both axes are divided by the estimated rotation curve for each galaxy and the total mass in each radial bin, thus the values displayed are approximately equal to galactic radius in kpc. The bar’s CR, its OLR, and the truncation radius are shown as the dotted-red, solid-blue, and dashed green circles (density) or vertical lines (ΔL) in each plot. The red arrow heads indicate strong increases in ΔL near the disc break for the gSa model, resulting in the more extended disc seen in Fig. 4.
Current usage metrics show cumulative count of Article Views (full-text article views including HTML views, PDF and ePub downloads, according to the available data) and Abstracts Views on Vision4Press platform.
Data correspond to usage on the plateform after 2015. The current usage metrics is available 48-96 hours after online publication and is updated daily on week days.
Initial download of the metrics may take a while.