Fig. 4
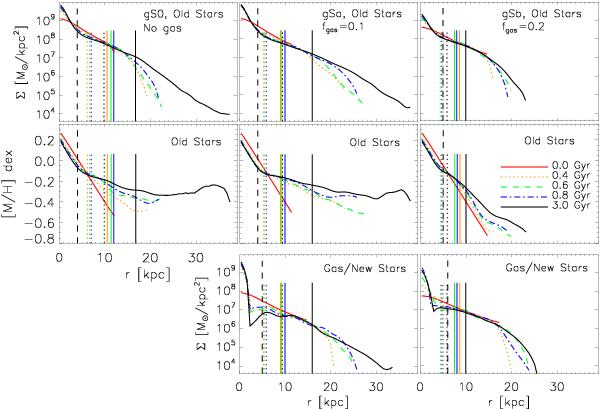
Temporal evolution of the azimuthally averaged density (top row) and metallicity (middle row) disc profiles for our galaxy models. Bulge particles are not considered. The different times shown are color coded as indicated in the second row, third column. The time evolution of the bars’ corotation and outer Lindblad resonances are shown by the dotted and solid vertical lines, respectively, where the colors correspond to the different times. Note that the bars slow down considerably, especially in the simulation lacking a gaseous component (gS0).
Current usage metrics show cumulative count of Article Views (full-text article views including HTML views, PDF and ePub downloads, according to the available data) and Abstracts Views on Vision4Press platform.
Data correspond to usage on the plateform after 2015. The current usage metrics is available 48-96 hours after online publication and is updated daily on week days.
Initial download of the metrics may take a while.