Fig. 2
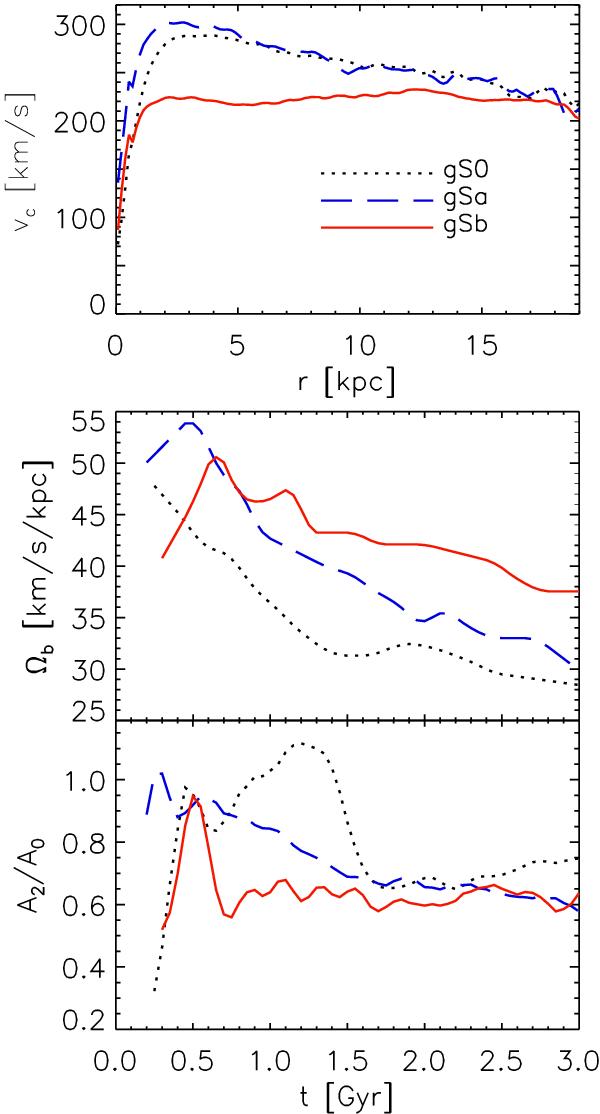
Top panel: circular velocities at t = 2 Gyr for the gS0, gSa and gSb models. Middle panel: time evolution of the bar pattern speeds, Ωb. Bottom panel: m = 2 Fourier amplitudes, A2/A0, as a function of time. Note that here we take the maximum values inside the bar; these are not sensitive to the lengths of the bars which can be seen in the bottom row of Fig. 1.
Current usage metrics show cumulative count of Article Views (full-text article views including HTML views, PDF and ePub downloads, according to the available data) and Abstracts Views on Vision4Press platform.
Data correspond to usage on the plateform after 2015. The current usage metrics is available 48-96 hours after online publication and is updated daily on week days.
Initial download of the metrics may take a while.