Fig. 17
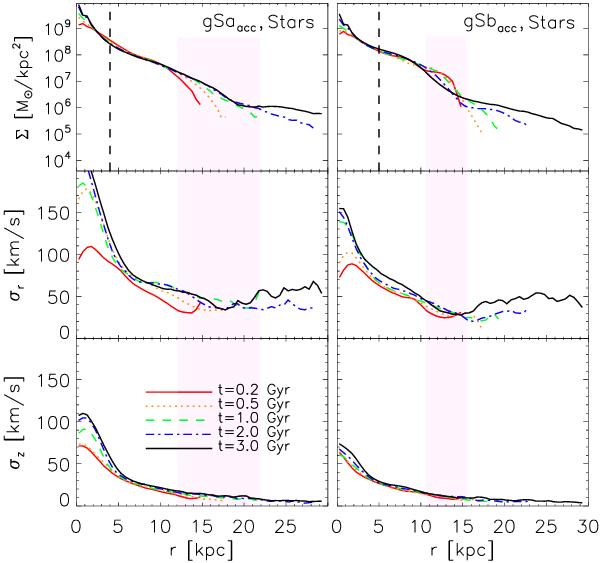
The effect of smooth, in-plane gas accretion. The pink strips show the gas accretion region for simulations starting with the initial conditions used for the gSa and gSb models. The radial disc profiles are shown in the first row. An up-turn in the radial velocity dispersion profile, σr(r), close to the disc break is evident in the second row, while the vertical velocity dispersion continuously decrease with r (bottom row).
Current usage metrics show cumulative count of Article Views (full-text article views including HTML views, PDF and ePub downloads, according to the available data) and Abstracts Views on Vision4Press platform.
Data correspond to usage on the plateform after 2015. The current usage metrics is available 48-96 hours after online publication and is updated daily on week days.
Initial download of the metrics may take a while.