Fig. 15
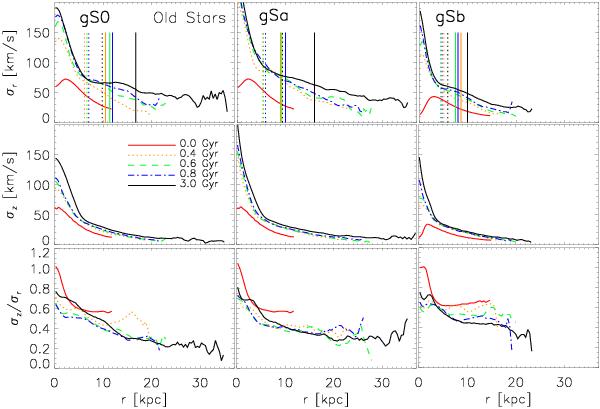
First row: time evolution of the radial velocity dispersion profiles, σr(r), for the gS0, gSa, and gSb models. Different colors and line styles correspond to the times indicated in the second row, first panel. The bars’ CR and 2:1 OLR are shown by the dotted and solid vertical lines, respectively. Second row: same but for the vertical velocity dispersion, σz(r). Third row: same but for the ratio σz/σr. The slope in σz/σr outside the bar shows that the radial profile flattens more with time than the vertical one, while its overall decrease means that the disc heats more radially than vertically. This is related to the conservation of vertical action. See text for discussion.
Current usage metrics show cumulative count of Article Views (full-text article views including HTML views, PDF and ePub downloads, according to the available data) and Abstracts Views on Vision4Press platform.
Data correspond to usage on the plateform after 2015. The current usage metrics is available 48-96 hours after online publication and is updated daily on week days.
Initial download of the metrics may take a while.