Fig. 13
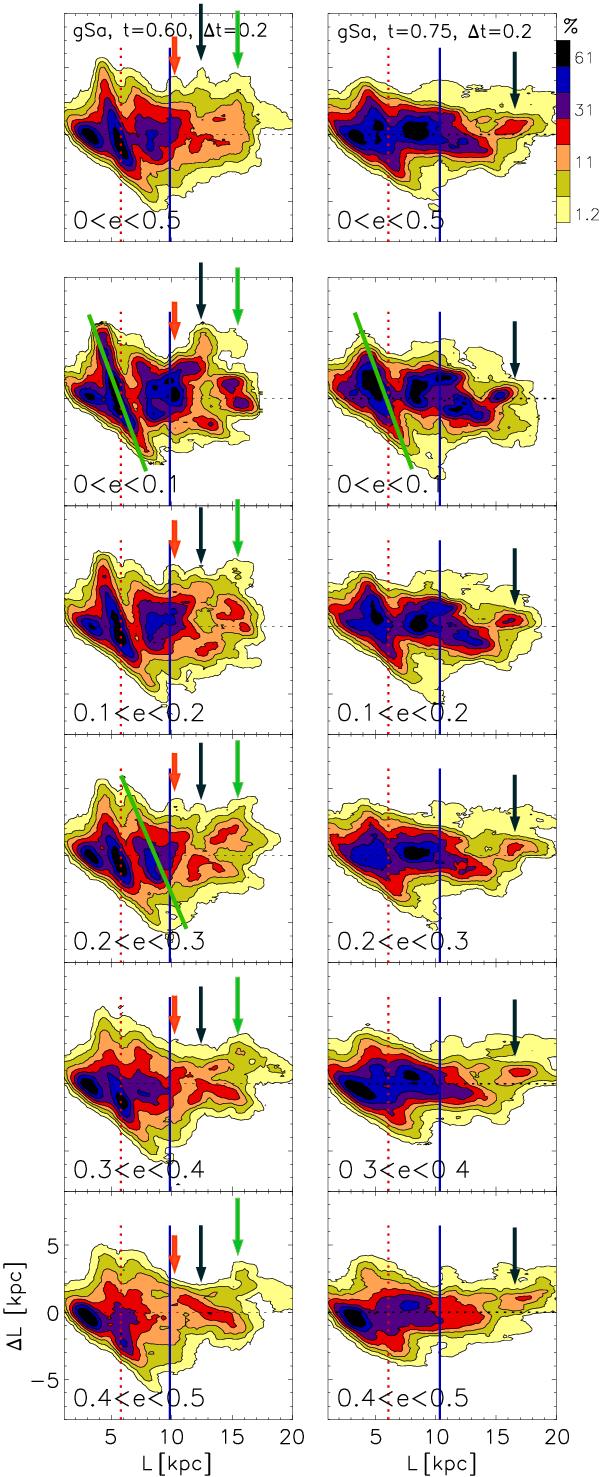
Comparison between the changes in angular momentum for particle samples with different eccentricities at two distinct times for the gSa model. Eccentricities are measured after the particles have migrated. First row: incremental changes in ΔL in 200 Myr, centered on 0.6 (left) and 0.75 Gyr (right). Rows 2 − 7: subsamples from the total sample shown in the first row, for particles with increasing eccentricities, as shown in each panel. There are no overlaps in the subsets. The green lines of negative slope show three CR-like features. The only well defined such structure seen outside the bar is found in the fourth row. Note that cold orbits in the outer disc (second row) do not exhibit the behavior expected at a CR (clearly seen for the bar), indicating the effects of non-linear coupling among waves. The three prominent peaks shown by the arrows in the upper left panel change differently with variations in eccentricity, suggesting that different dynamical processes are responsible for them.
Current usage metrics show cumulative count of Article Views (full-text article views including HTML views, PDF and ePub downloads, according to the available data) and Abstracts Views on Vision4Press platform.
Data correspond to usage on the plateform after 2015. The current usage metrics is available 48-96 hours after online publication and is updated daily on week days.
Initial download of the metrics may take a while.