Fig. 12
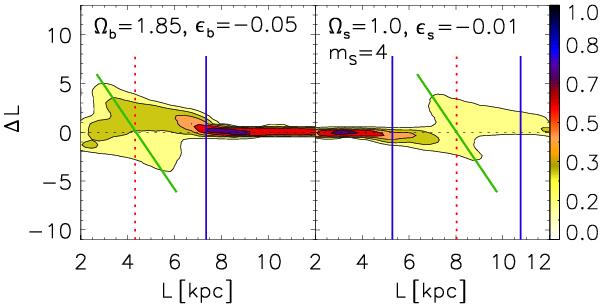
The L − ΔL plane for a single perturber: a bar (left panel) and a four-armed spiral wave (right panel), from the test-particle simulations presented in Minchev & Famaey (2010). The bar and spiral pattern speeds and strengths are indicated by Ωb,s and ϵb,s, respectively. The dotted-red vertical lines indicate the CR of each perturber and the solid-blue ones – the ILR and OLR. The color bar shows the normalized particle density. Such a shape of the distribution (indicated by the green line), with an increase in ΔL inside and a decrease outside the CR is characteristic for a single perturber, but not when perturbers interact as discussed in the text.
Current usage metrics show cumulative count of Article Views (full-text article views including HTML views, PDF and ePub downloads, according to the available data) and Abstracts Views on Vision4Press platform.
Data correspond to usage on the plateform after 2015. The current usage metrics is available 48-96 hours after online publication and is updated daily on week days.
Initial download of the metrics may take a while.