Fig. 11
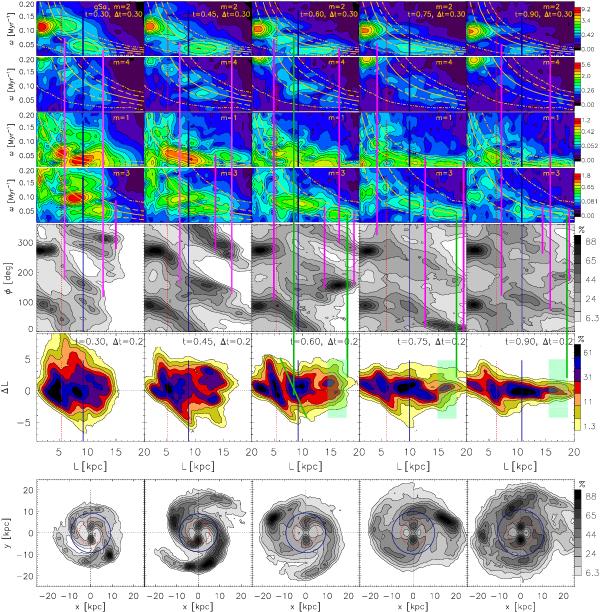
Rows 1 − 4: same as Fig. 10. Row 5: stellar density contours of galactic azimuth vs. radius. An attempt is made to match the waves of different multiplicities to the spiral features seen in the stellar density: pink vertical lines connect the most likely matches. Many waves cannot be seen in the stellar disc due to constructive/destructive interference. Row 6: incremental changes in angular momentum computed in 200 Myr spans, centered on the same times as the spectrograms above. The vertical green lines connect the likely waves/resonances and their effect on ΔL. The effect of the inner m = 2 spiral, as it sweeps its CR between the bar and the outer m = 2 wave, is shown by the green slanted line in the middle column. Resonant widths increase as the resonance curves (orange) flatten in the outer disc: clumps in ΔL are highlighted by the green shaded rectangles in the last three columns. Row 7: face-on differential stellar density contours for the same times.
Current usage metrics show cumulative count of Article Views (full-text article views including HTML views, PDF and ePub downloads, according to the available data) and Abstracts Views on Vision4Press platform.
Data correspond to usage on the plateform after 2015. The current usage metrics is available 48-96 hours after online publication and is updated daily on week days.
Initial download of the metrics may take a while.