Fig. 10
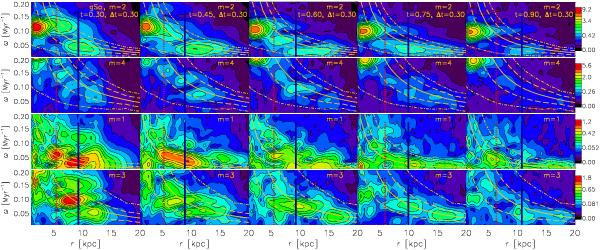
Time evolution of the m = 2,4,1, and 3 (top to bottom) power spectra for the gSa model. The vertical axis shows the frequency, ω = mΩ (in units of km s-1 kpc-1), rather than the pattern speed Ω, as done in Fig. 9, in order to facilitate a discussion of coupling between different modes. Time outputs are every 150 Myr with a time window Δt = 300 Myr. Contour levels are normalized for each multiplicity to better follow the changes in amplitude. The orange curves show the resonant loci as in Fig. 9. It is clear that the outer m = 2 wave has a stable pattern speed (slowly decreasing as the bar slows down) for over 600 Myr, while slowly weakening and extending outward with time. In contrast, the inner m = 2 wave bounces between the bar and the outer one at the beat frequency of the latter two patterns. The m = 3 waves are also present for the entire time, shifting outwards with time and largely coinciding in radius with the m = 1 features.
Current usage metrics show cumulative count of Article Views (full-text article views including HTML views, PDF and ePub downloads, according to the available data) and Abstracts Views on Vision4Press platform.
Data correspond to usage on the plateform after 2015. The current usage metrics is available 48-96 hours after online publication and is updated daily on week days.
Initial download of the metrics may take a while.