Fig. 1
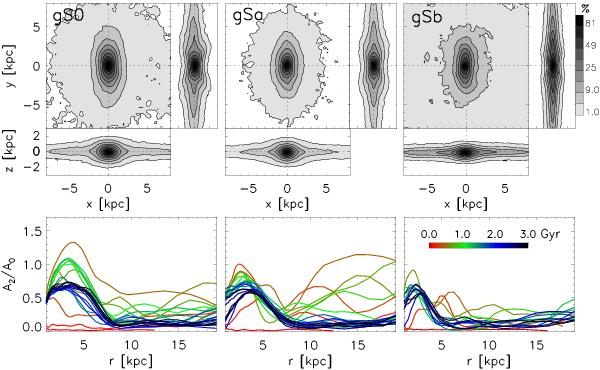
Top row: bar morphologies for the gS0, gSa, and gSb models at t = 2 Gyr. For each galaxy we show a set of three panels: the disc surface density face-on view is presented in the square panel, with the bar side-on and head-on views in the attached right and bottom panels, respectively. Bottom row: m = 2 Fourier amplitudes, A2/A0, as a function of radius from t = 0 to t = 3 Gyr as indicated by the color bar in the rightmost panel. The formation and evolution of a bar can be seen clearly in all inner discs. Deviations from zero in the outer disc indicate the strength of two-armed spirals.
Current usage metrics show cumulative count of Article Views (full-text article views including HTML views, PDF and ePub downloads, according to the available data) and Abstracts Views on Vision4Press platform.
Data correspond to usage on the plateform after 2015. The current usage metrics is available 48-96 hours after online publication and is updated daily on week days.
Initial download of the metrics may take a while.