Fig. 5
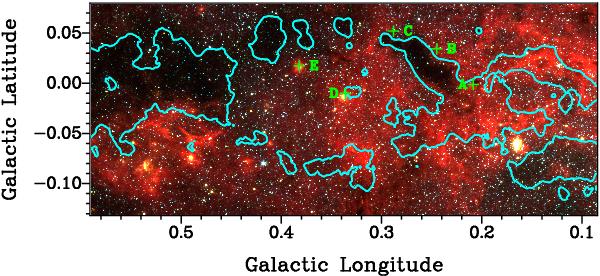
Dust ridge clouds in absorption against the infrared background (GLIMPSE RGB image: blue = 3.6 μm, green = 4.5 μm, red = 8.0 μm). The contour shows dust emission at 20% of the peak, with 1% corresponding to 2σ. A strong correlation exists between the distribution of the dust emission and the shape of the infrared dark clouds. Green crosses and upper case letters mark the positions of the radio sources detected. Strong infrared emission is seen at the positions of the radio sources A, D, and E.
Current usage metrics show cumulative count of Article Views (full-text article views including HTML views, PDF and ePub downloads, according to the available data) and Abstracts Views on Vision4Press platform.
Data correspond to usage on the plateform after 2015. The current usage metrics is available 48-96 hours after online publication and is updated daily on week days.
Initial download of the metrics may take a while.