Fig. 2
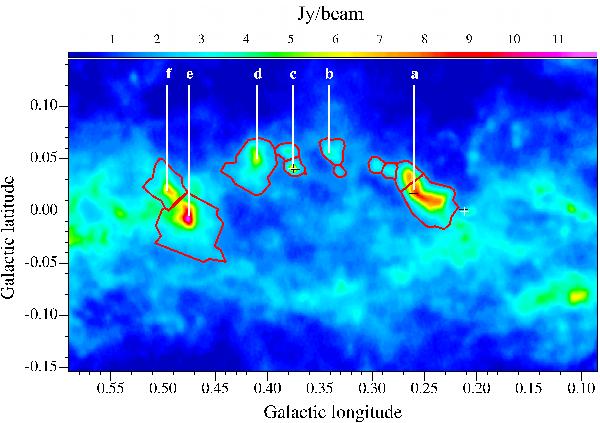
Dust continuum emission towards the dust ridge (arc of dust condensations bent to the north) at 870 μm. The contours show the sizes of the molecular clouds over which the emission was integrated for the cloud mass determination. Water and methanol masers are marked with black and white crosses, respectively. The letters mark the positions at which Lis et al. (1999) determined the dust temperature from the SED fits.
Current usage metrics show cumulative count of Article Views (full-text article views including HTML views, PDF and ePub downloads, according to the available data) and Abstracts Views on Vision4Press platform.
Data correspond to usage on the plateform after 2015. The current usage metrics is available 48-96 hours after online publication and is updated daily on week days.
Initial download of the metrics may take a while.