Free Access
Fig. 1
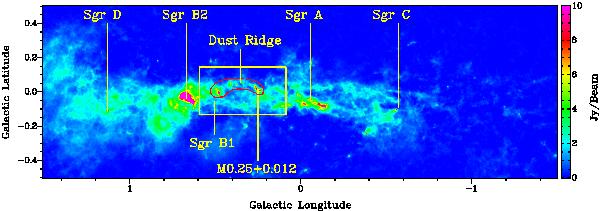
870 μm dust continuum emission of the central molecular zone. The figure shows the position of the dust ridge (red contour) and the large molecular cloud M0.25+0.012 in relation to other famous molecular complexes: Sgr A, Sgr B1, Sgr B2, Sgr C, and Sgr D. The region within the yellow box is enlarged in Fig. 2.
Current usage metrics show cumulative count of Article Views (full-text article views including HTML views, PDF and ePub downloads, according to the available data) and Abstracts Views on Vision4Press platform.
Data correspond to usage on the plateform after 2015. The current usage metrics is available 48-96 hours after online publication and is updated daily on week days.
Initial download of the metrics may take a while.