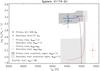
Fig. 5
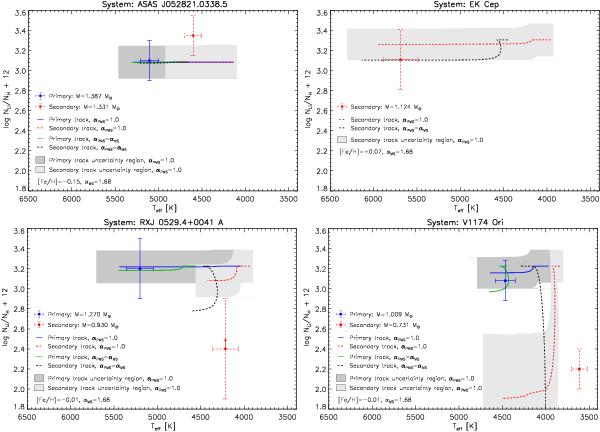
Comparison between theoretical predictions and observations for surface lithium abundance in the selected binary systems. Lithium evolutionary tracks for low-convection efficiency (αPMS = 1.0) corresponding to the primary (blue-solid line) and the secondary star (red-dashed line) have been computed for the labelled chemical composition and mass. Shaded area represents the uncertainty regions for the primary (dark-shaded area) and secondary stars in the system (light-shaded area). We also show the primary and secondary evolutionary tracks computed with αPMS = αMS (green-solid and black-dashed lines, respectively).
Current usage metrics show cumulative count of Article Views (full-text article views including HTML views, PDF and ePub downloads, according to the available data) and Abstracts Views on Vision4Press platform.
Data correspond to usage on the plateform after 2015. The current usage metrics is available 48-96 hours after online publication and is updated daily on week days.
Initial download of the metrics may take a while.