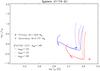
Fig. 4
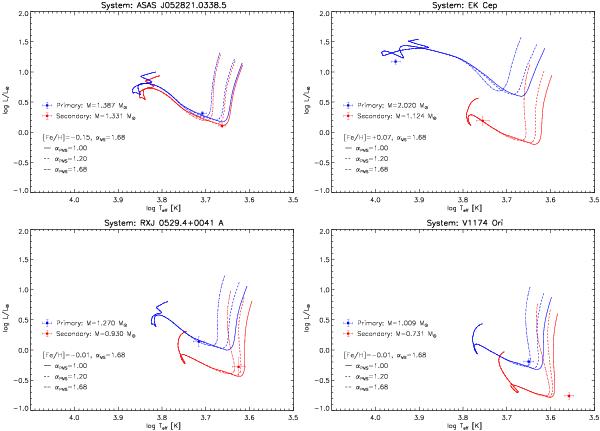
HR diagram for the selected sample of EBs (see text). For each system we plotted the models for the labelled chemical composition and mass, corresponding to the primary (blue line) and the secondary star (red line). Models have been computed by adopting three different values for the mixing length parameter, namely αPMS = 1.0 (solid line), 1.20 (dashed line), and 1.68 (dot-dashed line). Observational data are shown (filled circles), together with their uncertainty.
Current usage metrics show cumulative count of Article Views (full-text article views including HTML views, PDF and ePub downloads, according to the available data) and Abstracts Views on Vision4Press platform.
Data correspond to usage on the plateform after 2015. The current usage metrics is available 48-96 hours after online publication and is updated daily on week days.
Initial download of the metrics may take a while.