Fig. 2
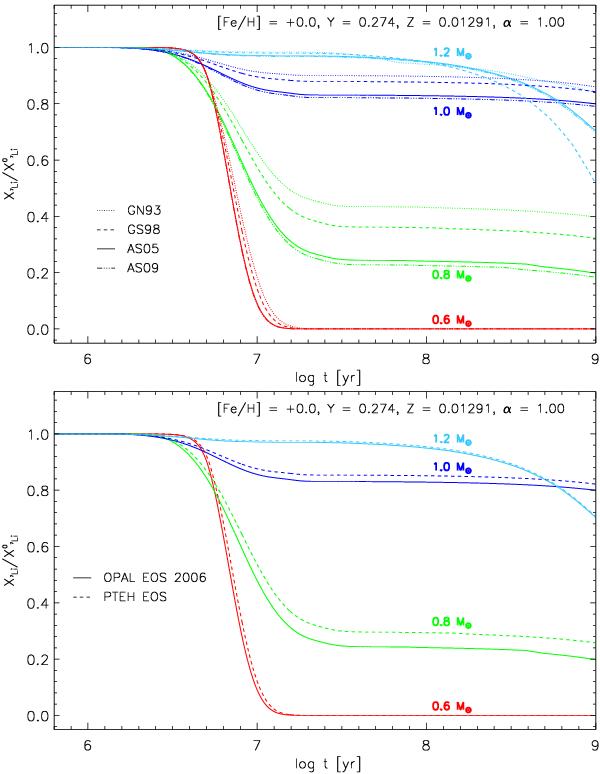
Comparison among the surface lithium abundance obtained with our reference set of tracks (solid line) and models with different assumptions on the adopted physical inputs, for M = 0.6, 0.8, 1.0, and 1.2 M⊙ with Z = 0.01291, Y = 0.274, and α = 1. Upper panel: effect of the change of the solar mixture (GN93, GS98, AS05, and AS09 ones) in the opacity tables. Bottom panel: effect of adopting the OPAL 2006 and PTEH EOS.
Current usage metrics show cumulative count of Article Views (full-text article views including HTML views, PDF and ePub downloads, according to the available data) and Abstracts Views on Vision4Press platform.
Data correspond to usage on the plateform after 2015. The current usage metrics is available 48-96 hours after online publication and is updated daily on week days.
Initial download of the metrics may take a while.