Fig. 8
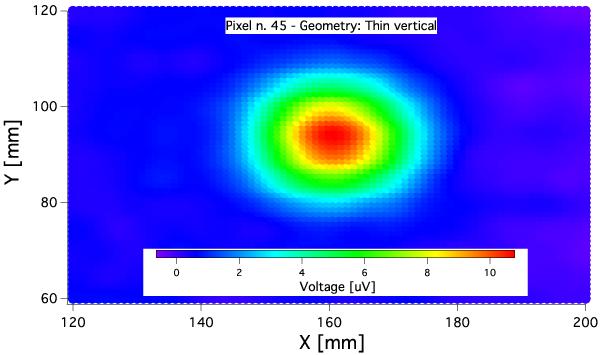
Color palette plot for one pixel showing a signal of 10.8 μV in the light absorption generated by a blackbody radiation whose temperature is modulated between 77 and 300 K. X and Y axis of the plot correspond to the position – in mm – of the blackbody hole in the front focal plane, outside the cryostat. (This figure is available in color in the electronic form.)
Current usage metrics show cumulative count of Article Views (full-text article views including HTML views, PDF and ePub downloads, according to the available data) and Abstracts Views on Vision4Press platform.
Data correspond to usage on the plateform after 2015. The current usage metrics is available 48-96 hours after online publication and is updated daily on week days.
Initial download of the metrics may take a while.