Fig. 4
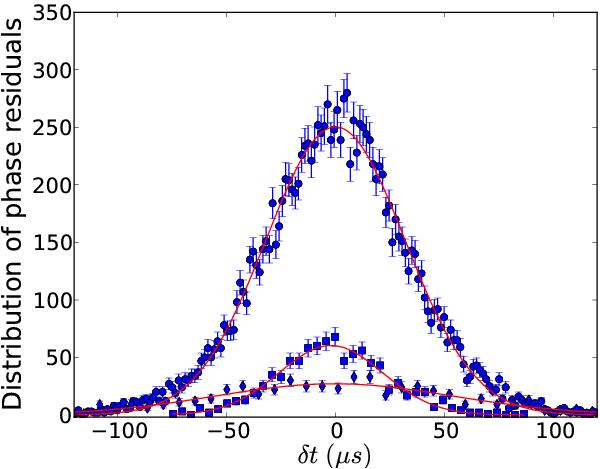
Residual distribution of the optical phase of the main pulse around the best fit shown in Fig. 2. Each point represents the number of phase residuals Ni in the ith bin. The error bar on each bin is  . The three datasets refer to all observations (circles), to observation 4 (squares) and observation 1 (diamonds). The bin widths are 1.5 μs, 4.1 μs, and 7.3 μs. The (red) solid lines superimposed to each dataset represent the best-fitting Gaussian with σ ~ 32 μs (circles), σ ~ 24 μs (squares) and σ ~ 54 μs (diamonds).
Current usage metrics show cumulative count of Article Views (full-text article views including HTML views, PDF and ePub downloads, according to the available data) and Abstracts Views on Vision4Press platform.
Data correspond to usage on the plateform after 2015. The current usage metrics is available 48-96 hours after online publication and is updated daily on week days.
Initial download of the metrics may take a while.