Fig. 3
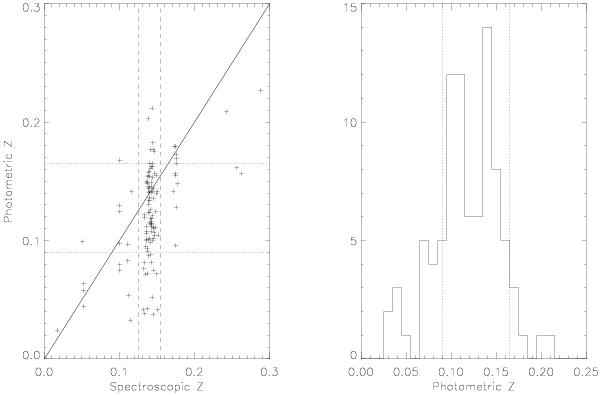
Left: comparison between spectroscopic redshifts (CFHT+SDSS) and photometric redshifts from the SDSS DR7 (R < 21). Dashed line represents the spectroscopic range used to select cluster members [0.125−0.155]. Dotted lines show the photometric range chosen to define cluster membership [0.09, 0.165]. Right: photometric redshifts histogram of the spectroscopically confirmed cluster members (0.125 < z < 0.155) with magnitude R < 21. Dotted line show the photometric range defining cluster membership [0.09, 0.165].
Current usage metrics show cumulative count of Article Views (full-text article views including HTML views, PDF and ePub downloads, according to the available data) and Abstracts Views on Vision4Press platform.
Data correspond to usage on the plateform after 2015. The current usage metrics is available 48-96 hours after online publication and is updated daily on week days.
Initial download of the metrics may take a while.