Fig. 10
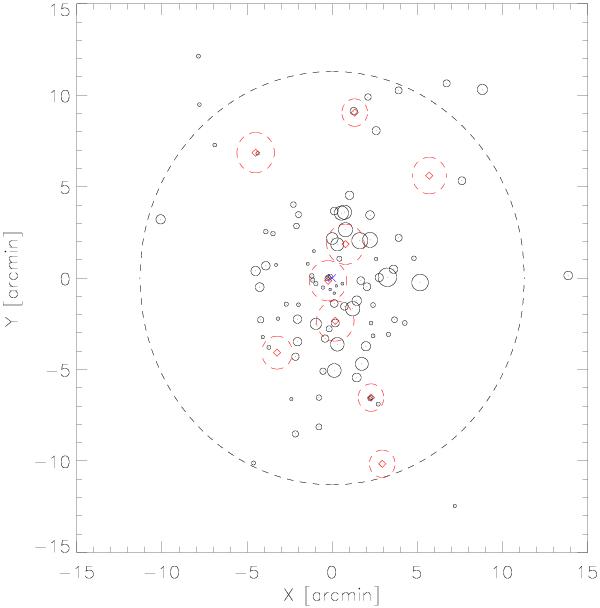
Projected positions of the galaxies in our spectroscopic catalog (R < 21), represented by circles with sizes weighted by the δ estimator of Dressler & Shectman (1988). Concentration of large circles indicate a correlated spatial and kinematic variation. The substructures identified in the galaxy density map are shown as red diamonds delimited by dashed circles.
Current usage metrics show cumulative count of Article Views (full-text article views including HTML views, PDF and ePub downloads, according to the available data) and Abstracts Views on Vision4Press platform.
Data correspond to usage on the plateform after 2015. The current usage metrics is available 48-96 hours after online publication and is updated daily on week days.
Initial download of the metrics may take a while.