Fig. 9
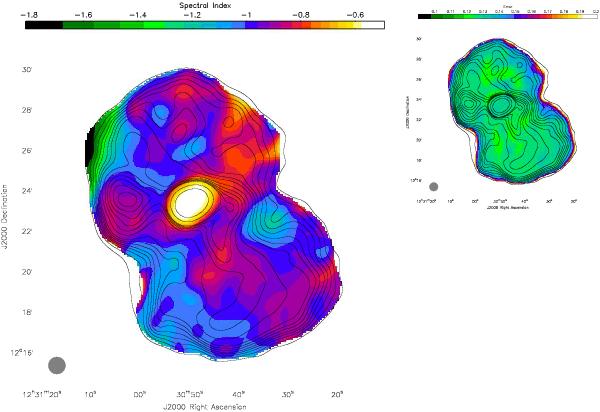
Left figure: low-frequency spectral index map obtained from LOFAR-LBA (45−71 MHz only) and LOFAR-HBA (115−162 MHz) observations, together with VLA map at 325 MHz. All maps were convolved to a resolution of 50′′ (see circle in the lower left corner) and a pixel-by-pixel linear regression was extracted. Pixels where the error were above 3σ are blanked. Contour lines are from the 325 MHz map. Top figure: spectral index 1σ error map.
Current usage metrics show cumulative count of Article Views (full-text article views including HTML views, PDF and ePub downloads, according to the available data) and Abstracts Views on Vision4Press platform.
Data correspond to usage on the plateform after 2015. The current usage metrics is available 48-96 hours after online publication and is updated daily on week days.
Initial download of the metrics may take a while.