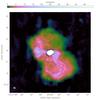
Fig. 6
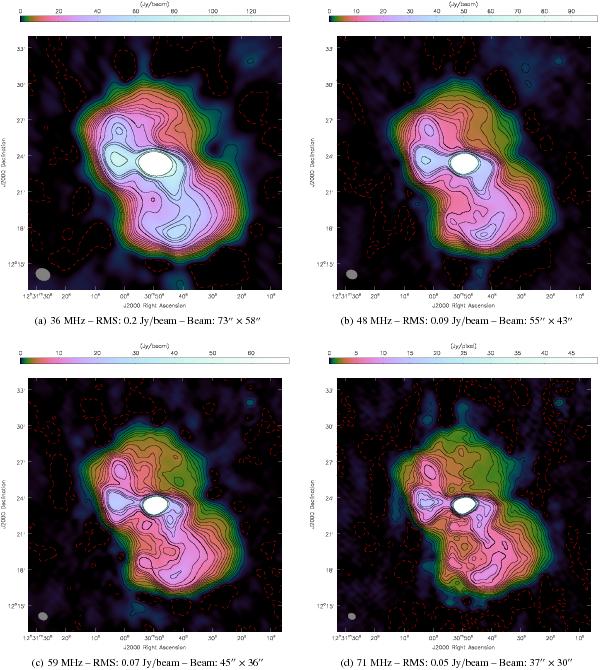
LOFAR-LBA images of Virgo A at frequencies ranging from 36 to 71 MHz. Each image is a result of a multi-scale multi-frequency cleaning on a subset of 60 SBs. The beam shape is visible in the bottom-left corner of each image. Positive contour levels are represented by black lines at (1, 2, 3, 4, 5, 6, 8, 10, 12, 14, 16, 18, 20, 25, 30, 25, 40, 45, 50, 75, 100) × 5σ. Negative contour levels at −1σ are represented by a red dashed line.
Current usage metrics show cumulative count of Article Views (full-text article views including HTML views, PDF and ePub downloads, according to the available data) and Abstracts Views on Vision4Press platform.
Data correspond to usage on the plateform after 2015. The current usage metrics is available 48-96 hours after online publication and is updated daily on week days.
Initial download of the metrics may take a while.