Fig. 3
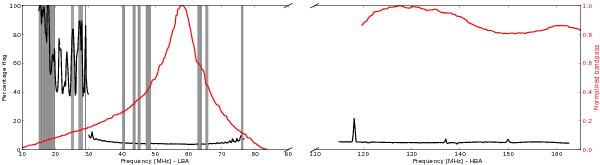
Black line: percentage of flagged data. In the frequency range 15−30 MHz, the last 37% of the observation was manually flagged. Red line: normalized bandpass (for HBA it is only available for a slightly shifted frequency range). The SBs removed because of corrupted data or a computer failure are coloured in grey. Completely flagged stations are not taken into account to compute the percentage of flagged data.
Current usage metrics show cumulative count of Article Views (full-text article views including HTML views, PDF and ePub downloads, according to the available data) and Abstracts Views on Vision4Press platform.
Data correspond to usage on the plateform after 2015. The current usage metrics is available 48-96 hours after online publication and is updated daily on week days.
Initial download of the metrics may take a while.