Fig. 16
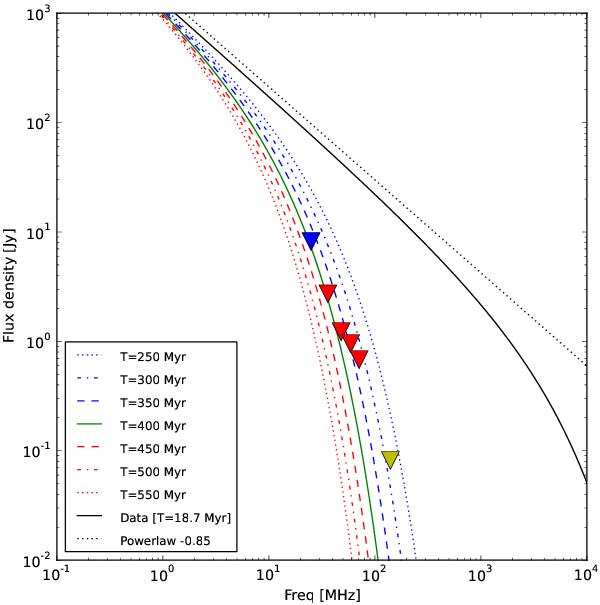
To estimate our capability to detect ancient outbursts we determined the maximum age of an emission we would be able to detect given the sensitivity of our maps. We took the zone H1 (Fig. 13) as representative for an old and inactive zone in the halo. Using its νb = 8.3 GHz and its estimated age of 18.7 Myr we let its spectrum evolve. In this figure we show the fit to the observed data as a black line. Coloured lines show the evolution of the expected spectral shape as time passes by (from top to bottom, after 250, 300, 350, 400, 450, 500 and 550 Myr, respectively, after the electron injection). Triangles indicates the 3σ detection limit for our maps. Blue is for the LBA-low map (Fig. 7), red for the four LBA-high maps (Fig. 6), while yellow for the HBA map (Fig. 5).
Current usage metrics show cumulative count of Article Views (full-text article views including HTML views, PDF and ePub downloads, according to the available data) and Abstracts Views on Vision4Press platform.
Data correspond to usage on the plateform after 2015. The current usage metrics is available 48-96 hours after online publication and is updated daily on week days.
Initial download of the metrics may take a while.