Fig. 12
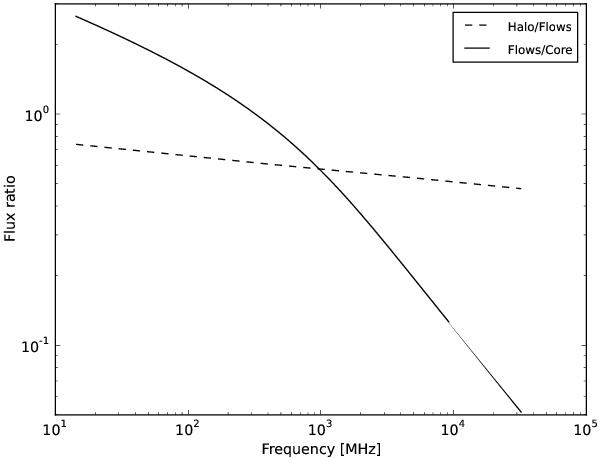
The solid line shows the ratio between the power-law fit to the cocoon zone (Fig. 10) and the CI-model fit to the flow zones (Fig. 11(c)). The dashed line shows the ratio between the CI-model fits to the flow zones (Fig. 11(c)) and to the halo (Fig. 11(b)). Simple synchrotron ageing would have left untouched the low-frequency part of the spectrum, producing in this plot a horizontal line until the point where the break frequency occurs. We notice instead a steepening in the spectrum, going from the central region to the flows and, to a lesser extent, from the flows to the halo.
Current usage metrics show cumulative count of Article Views (full-text article views including HTML views, PDF and ePub downloads, according to the available data) and Abstracts Views on Vision4Press platform.
Data correspond to usage on the plateform after 2015. The current usage metrics is available 48-96 hours after online publication and is updated daily on week days.
Initial download of the metrics may take a while.