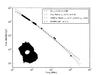
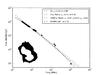
Fig. 11
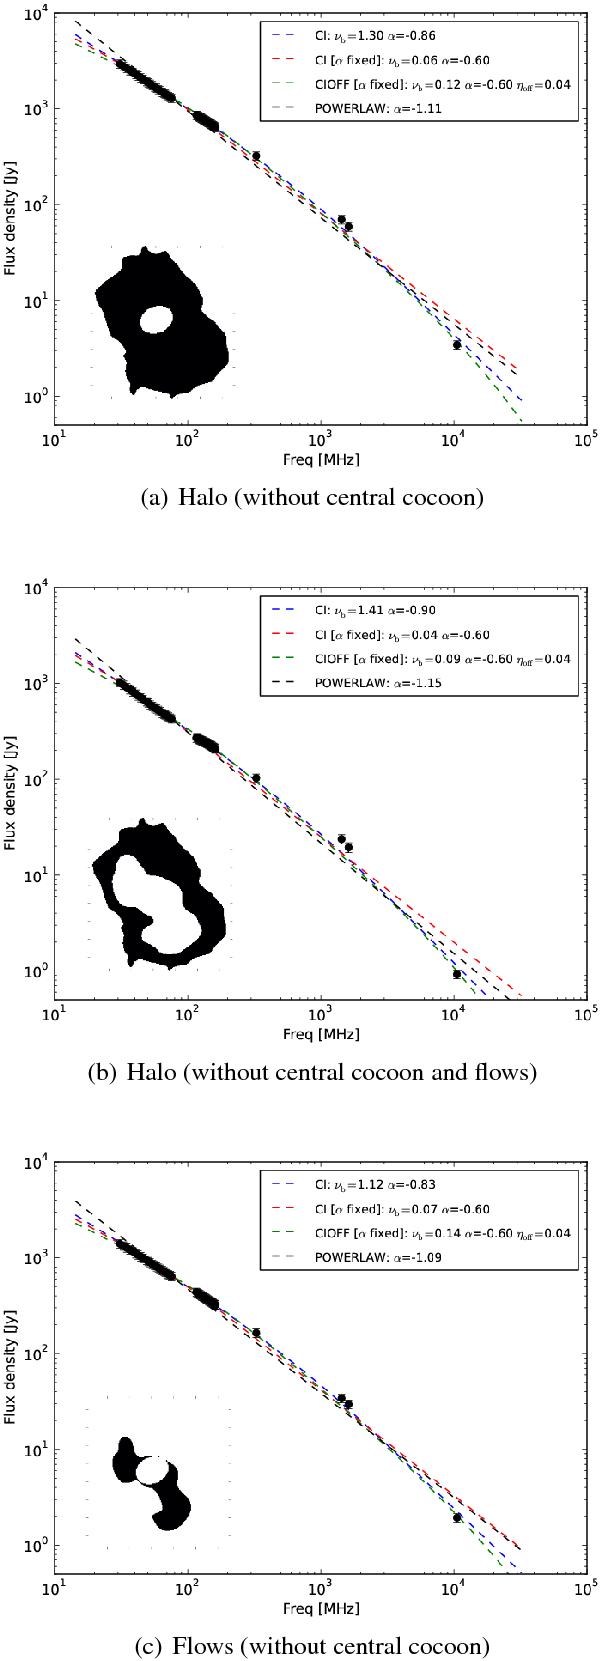
Spectral fits of the three macro-regions identified in Sect. 5.2.1. In each panel the mask used to select the region is shown in black in the bottom-left corner, the white part was excluded from the analysis. A simple power-law fit (black line) is shown together with two fits of the CI and CIOFF models. Red line: fit obtained fixing αinj to −0.6. Blue line: with αinj allowed to vary. A CI model with αinj = −0.6 is in general not able to fit the data. Finally, green lines show the fit of a CIOFF model with αinj fixed to −0.6. νb is in GHz.
Current usage metrics show cumulative count of Article Views (full-text article views including HTML views, PDF and ePub downloads, according to the available data) and Abstracts Views on Vision4Press platform.
Data correspond to usage on the plateform after 2015. The current usage metrics is available 48-96 hours after online publication and is updated daily on week days.
Initial download of the metrics may take a while.