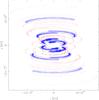
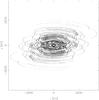
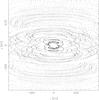
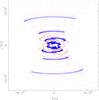
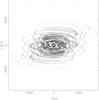
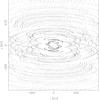
Fig. 1
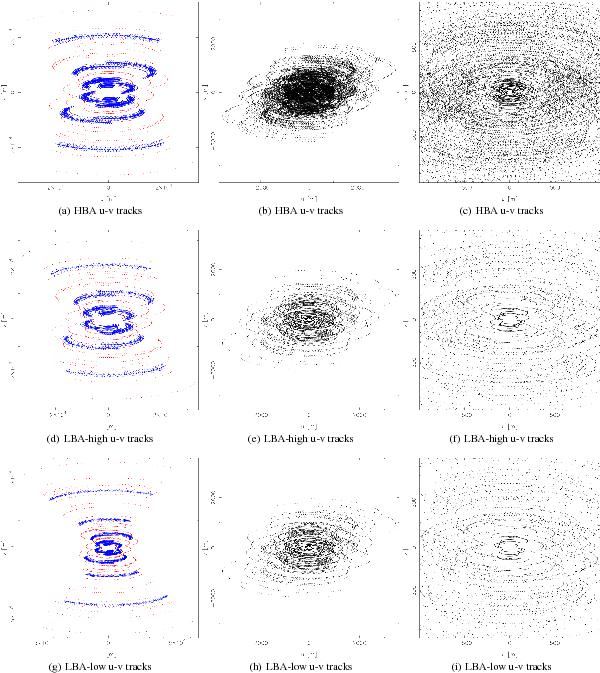
uv-coverage for the three observations of Virgo A: the first row is the HBA observation, the second row the LBA-high observation and the third row the LBA-low observation. In the first column are plotted only tracks involving remote stations (blue: core-remote baselines – red: remote-remote baselines). In the second column only tracks of core-core baselines are plotted. The last column is a zoom-in on the centre of the uv-plane.
Current usage metrics show cumulative count of Article Views (full-text article views including HTML views, PDF and ePub downloads, according to the available data) and Abstracts Views on Vision4Press platform.
Data correspond to usage on the plateform after 2015. The current usage metrics is available 48-96 hours after online publication and is updated daily on week days.
Initial download of the metrics may take a while.