Fig. 8
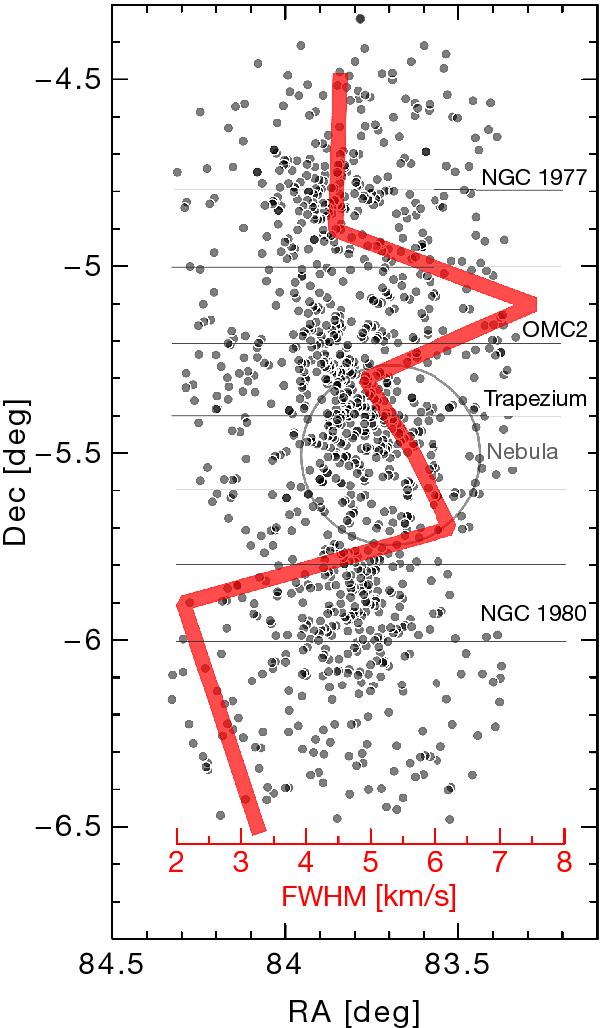
North-south velocity dispersion profile of the ONC region. The filled circles represent the sources in Tobin et al. (2009) with reliable radial velocities. The NGC 1977, the Trapezium cluster, and NGC 1980 are indicated, as well as the extent of the Orion nebula (light open circle). The thick red line represents the north-south velocity dispersion profile measured in bins of Declination (indicated by the thin horizontal lines). There is an increase from the Trapezium to the edge of the nebula to the south, followed by a clear minimum around NGC 1980, strongly suggesting that NGC 1980 is a different population from the stellar population inside the nebula. Data from Table 13 of Tobin et al. (2009).
Current usage metrics show cumulative count of Article Views (full-text article views including HTML views, PDF and ePub downloads, according to the available data) and Abstracts Views on Vision4Press platform.
Data correspond to usage on the plateform after 2015. The current usage metrics is available 48-96 hours after online publication and is updated daily on week days.
Initial download of the metrics may take a while.