Fig. 7
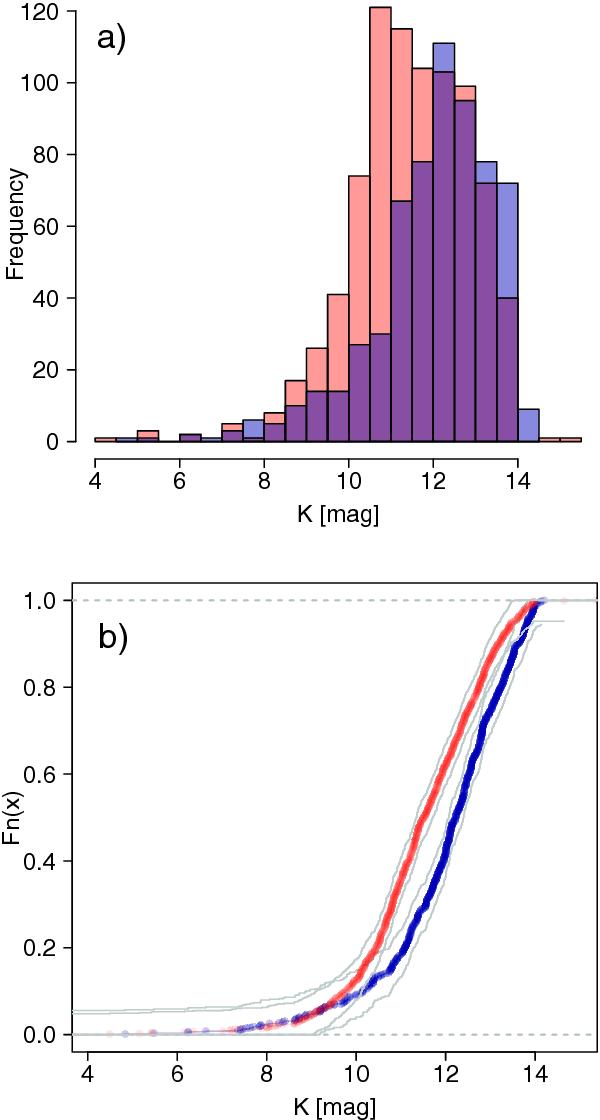
a) K-band luminosity functions for the foreground (blue) and the extincted (red) sample (see Fig. 4). Although it is affected by extinction, the red sample is surprisingly brighter than the foreground sample (blue), suggesting that the two populations are intrinsically different. b) Empirical cumulative distribution functions for both samples, together with upper and lower simultaneous 95% confidence curves, confirming that the two populations have statistically different luminosity functions.
Current usage metrics show cumulative count of Article Views (full-text article views including HTML views, PDF and ePub downloads, according to the available data) and Abstracts Views on Vision4Press platform.
Data correspond to usage on the plateform after 2015. The current usage metrics is available 48-96 hours after online publication and is updated daily on week days.
Initial download of the metrics may take a while.