Fig. 5
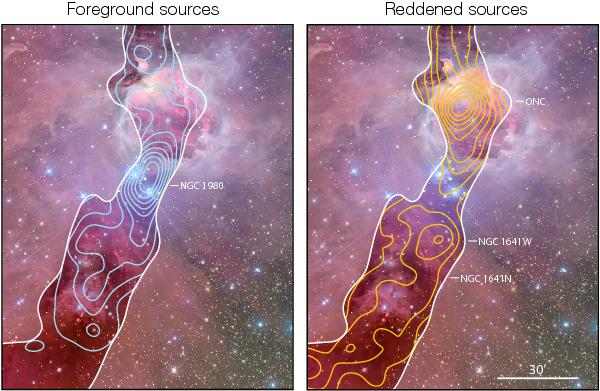
Left panel: spatial density of the foreground sources (blue sample). The unshaded area in the figure represents the region of the cloud where AV ≥ 5 mag, on which the selection was performed. The blue contours (with increments of 10% from the maximum) represent the surface density of foreground sources (constructed with a Gaussian kernel with a width of 20′). Right panel: same as in the left panel but for the reddened sources. The distribution of foreground sources shows a clearly defined peak coinciding with the poorly studied NGC 1980. The reddened sources, on the other hand, peak around 1) the Trapezium cluster and are mostly confined to the nebula and 2) the L1641N star-forming region, with a peak toward a hitherto unrecognized group of YSOs (see text). The reddened and foreground populations are spatially uncorrelated but there is significant overlap between the two, in particular with the sources inside the Orion nebula.
Current usage metrics show cumulative count of Article Views (full-text article views including HTML views, PDF and ePub downloads, according to the available data) and Abstracts Views on Vision4Press platform.
Data correspond to usage on the plateform after 2015. The current usage metrics is available 48-96 hours after online publication and is updated daily on week days.
Initial download of the metrics may take a while.