Fig. 4
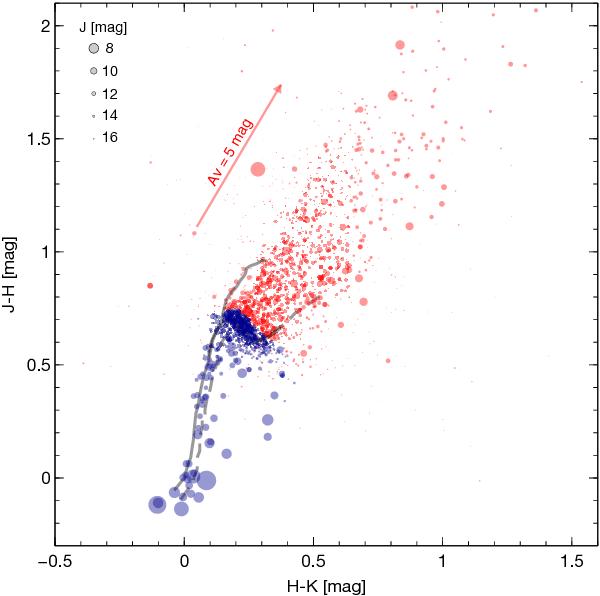
J − H versus H − K color−color versus J brightness diagram. The solid gray lines represent the main sequence and giant sequences from Bessell & Brett (1988). The dashed gray line represents the main sequence from Kraus & Hillenbrand (2007). The sizes of the symbols are proportional to the J-band brightness. Sources taken as foreground candidates are marked in blue, while rejected sources, mostly extincted sources, are marked in red.
Current usage metrics show cumulative count of Article Views (full-text article views including HTML views, PDF and ePub downloads, according to the available data) and Abstracts Views on Vision4Press platform.
Data correspond to usage on the plateform after 2015. The current usage metrics is available 48-96 hours after online publication and is updated daily on week days.
Initial download of the metrics may take a while.