Fig. 2
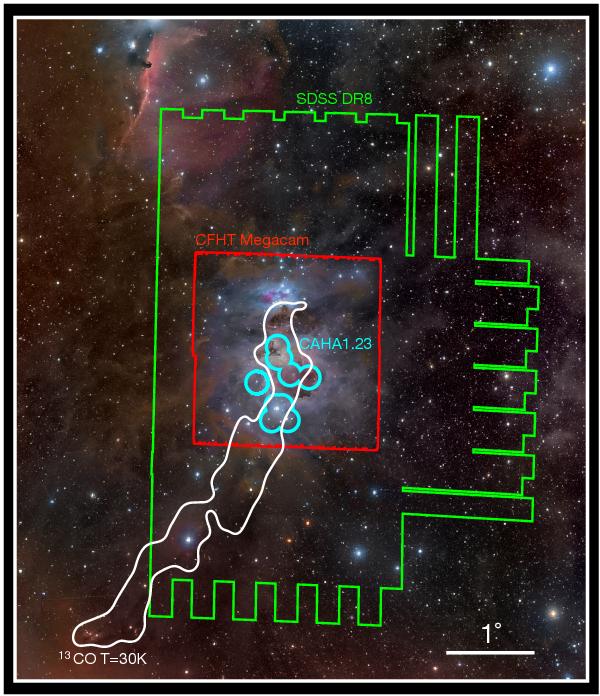
Coverage of the optical datasets used in this study. The SDSS images used in this study are represented in green, the CFHT/Megacam images in red, and the Calar Alto 1.23 m CCD observations are represented in light blue. The contour corresponding to an integrated intensity of 13CO of 30 K km s-1 is represented in white. North is up and east is left. The angular scale is indicated in the lower left. Background photograph courtesy of Rogelio Bernal Andreo (DeepSkyColors.com).
Current usage metrics show cumulative count of Article Views (full-text article views including HTML views, PDF and ePub downloads, according to the available data) and Abstracts Views on Vision4Press platform.
Data correspond to usage on the plateform after 2015. The current usage metrics is available 48-96 hours after online publication and is updated daily on week days.
Initial download of the metrics may take a while.