Fig. 10
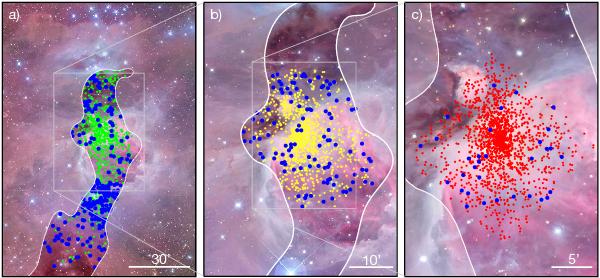
Matches between the foreground contamination and well-known catalogs of the ONC. a) In green, the optical spectroscopic survey of Tobin et al. (2009), matches with the foreground population are marked in blue. b) In yellow, the well-studied sample of Hillenbrand (1997), matches with the foreground population are marked in blue. c) In red, the sample of X-ray sources from the COUP project (Feigelson et al. 2002), matches with the foreground population are marked in blue. As in Fig. 5, the unshaded area represents the region of the cloud where AV ≥ 5 mag, on which the selection of foreground sources was performed.
Current usage metrics show cumulative count of Article Views (full-text article views including HTML views, PDF and ePub downloads, according to the available data) and Abstracts Views on Vision4Press platform.
Data correspond to usage on the plateform after 2015. The current usage metrics is available 48-96 hours after online publication and is updated daily on week days.
Initial download of the metrics may take a while.