Fig. 6
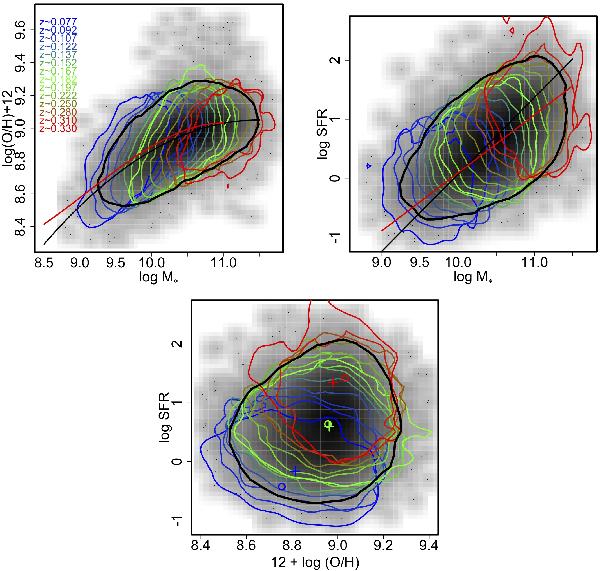
The GAMA mass-metallicity (upper left), mass-SFR (upper right) and metallicity-SFR (lower-middle) relationships in our main sample. Black and coloured contours show 2σ contours for the main and volume limited samples with median redshifts as labelled, respectively. Red and black solid lines show the fitted SDSS MMR from KE08 using the updated KD02 conversion and our fit to the GAMA data, respectively. Open circles in the lower panel show the expected mean metallicity and SFR as inferred from the mean mass using Eqs. (9) and (10) for the lowest, intermediate and highest redshift bins. The actual mean metallicity and SFR for these samples are shown with crosses (see Sect. 4.3).
Current usage metrics show cumulative count of Article Views (full-text article views including HTML views, PDF and ePub downloads, according to the available data) and Abstracts Views on Vision4Press platform.
Data correspond to usage on the plateform after 2015. The current usage metrics is available 48-96 hours after online publication and is updated daily on week days.
Initial download of the metrics may take a while.