Fig. 1
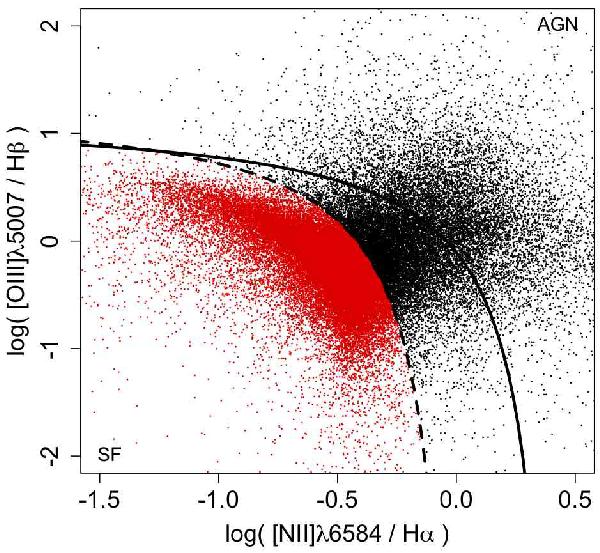
Selection of star-forming galaxies (red) using the prescription from Kauffmann et al. (2003, dashed line) BPT diagram (Baldwin et al. 1981). The solid line shows the prescription by Kewley et al. (2001). Objects with AGN-like spectra are close to the upper right while star-forming galaxies reside closer to the lower left corner as labelled.
Current usage metrics show cumulative count of Article Views (full-text article views including HTML views, PDF and ePub downloads, according to the available data) and Abstracts Views on Vision4Press platform.
Data correspond to usage on the plateform after 2015. The current usage metrics is available 48-96 hours after online publication and is updated daily on week days.
Initial download of the metrics may take a while.