Fig. 6
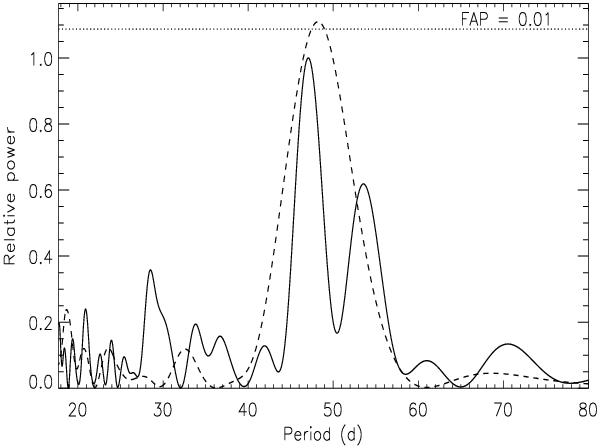
Lomb-Scargle periodogram of the variation of the spotted area. The solid line gives the normalized power vs. the period for the whole time interval, while the dashed line gives the power for the time interval from BJD 2 455 230.8696 to BJD 2 455 457.9294 with the same normalization as adopted for the periodogram of the whole interval. The horizontal dotted line marks the 99 percent confidence level (FAP = 0.01).
Current usage metrics show cumulative count of Article Views (full-text article views including HTML views, PDF and ePub downloads, according to the available data) and Abstracts Views on Vision4Press platform.
Data correspond to usage on the plateform after 2015. The current usage metrics is available 48-96 hours after online publication and is updated daily on week days.
Initial download of the metrics may take a while.