Fig. 4
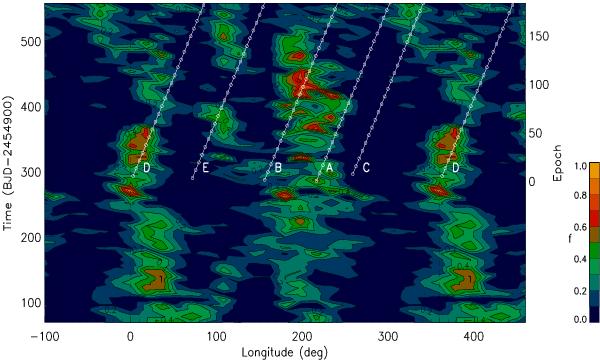
Distribution of the spot-filling factor vs. longitude and time for Q = 1.6. The values of the filling factor were normalized to their maximum fmax = 0.01553 with orange-yellow indicating the maximum and dark blue the minimum (see the colour scale on the right lower corner of the figure for the correspondence between the colour and the normalized filling factor). Note that the longitude scale is extended beyond 0° and 360° to help following the migration of the starspots. The tracks of the five spots occulted during the planetary transits after D11 are also reported. The open circles mark the time intervals of eight transits after which the same spots are detected again during the transits. The straight lines connecting the circles trace the migration of those spots in our reference frame; each line is labelled with the name of the corresponding spot, as indicated in Fig. 11 of D11.
Current usage metrics show cumulative count of Article Views (full-text article views including HTML views, PDF and ePub downloads, according to the available data) and Abstracts Views on Vision4Press platform.
Data correspond to usage on the plateform after 2015. The current usage metrics is available 48-96 hours after online publication and is updated daily on week days.
Initial download of the metrics may take a while.