Fig. 6
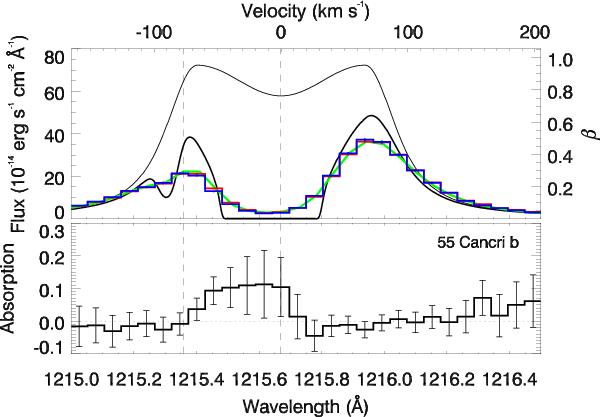
Top. Lyman-α line of 55 Cnc. Weighted co-addition of exposures flagged “in” (Fin; solid blue line) and “out” (Fout; solid red line) of the possible transit of 55 Cnc b’s extended atmosphere. The solid black lines show the stellar intrinsic emission profile before (thin) and after (thick) absorption by the interstellar medium, in terms of flux (left axis) or β ratio between radiation pressure and gravity (right axis). The absorbed profile is convoluted with the instrumental line spread function to yield the green profile, which is fit to the data. Dashed vertical lines delimit the region over which the flux is integrated to produce the light curve in Fig. 5. Bottom. Transmission spectrum showing the absorption depth δ = 1 − Fin/Fout during the possible transit of 55 Cnc b.
Current usage metrics show cumulative count of Article Views (full-text article views including HTML views, PDF and ePub downloads, according to the available data) and Abstracts Views on Vision4Press platform.
Data correspond to usage on the plateform after 2015. The current usage metrics is available 48-96 hours after online publication and is updated daily on week days.
Initial download of the metrics may take a while.