Fig. 5

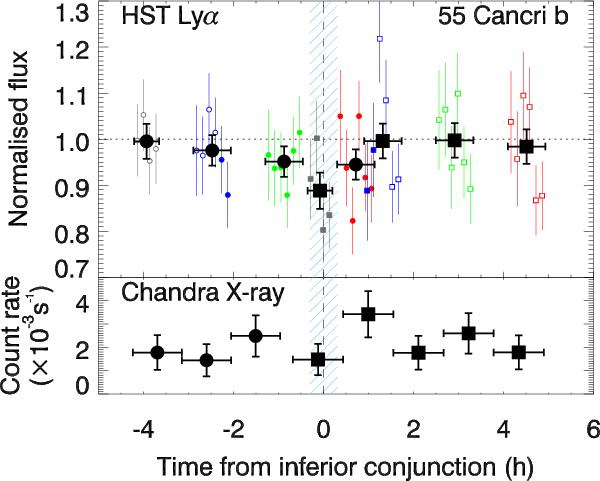
Top. Lyman-α light curve integrated between 1215.36 and 1215.67 Å or between −76.5 and 0 km s-1. The exposures from visits 1 (small circles) and 2 (small squares) have been phase-folded around the period of 55 Cnc b. The different colours (grey, blue, green, red) correspond to the four orbits in each visit. Exposures considered in and out of transit are differenciated by filled and empty symbols, respectively. The large black symbols (circles for visit 1, squares for visit 2) are the flux averages per orbit. The sky-blue hatched region shows the ± 19-min uncertainty on the inferior conjunction time. Bottom. Chandra X-ray count rate integrated over ~1-h bins.
Current usage metrics show cumulative count of Article Views (full-text article views including HTML views, PDF and ePub downloads, according to the available data) and Abstracts Views on Vision4Press platform.
Data correspond to usage on the plateform after 2015. The current usage metrics is available 48-96 hours after online publication and is updated daily on week days.
Initial download of the metrics may take a while.


