Free Access
Fig. 4
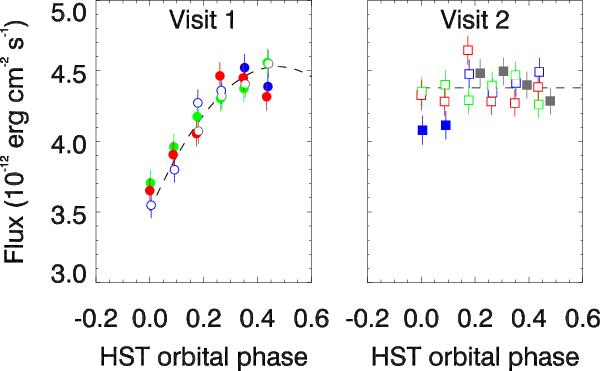
Lyman-α flux phase-folded on the HST orbital period. Filled symbols are exposures taken near the inferior conjunction of 55 Cnc b, which are excluded from the fit. The dashed lines indicate the best-fit quadratic function for visit 1 (“breathing effect”; left) and constant for visit 2 (right).
Current usage metrics show cumulative count of Article Views (full-text article views including HTML views, PDF and ePub downloads, according to the available data) and Abstracts Views on Vision4Press platform.
Data correspond to usage on the plateform after 2015. The current usage metrics is available 48-96 hours after online publication and is updated daily on week days.
Initial download of the metrics may take a while.