Fig. 2
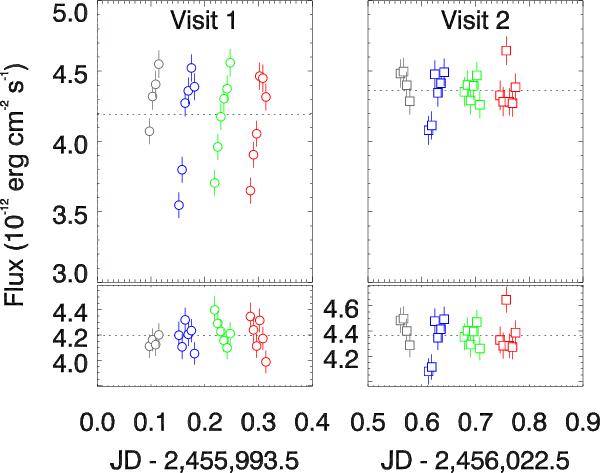
Top panels: Lyman-α flux integrated over the whole Lyα line as a function of time for 500-s sub-exposures in visits 1 (circles, left) and 2 (squares, right). The different colours mark the different HST orbits. Bottom panels: Lyman-α flux corrected for the “breathing effect”. Dotted lines show the mean fluxes in visits 1 and 2.
Current usage metrics show cumulative count of Article Views (full-text article views including HTML views, PDF and ePub downloads, according to the available data) and Abstracts Views on Vision4Press platform.
Data correspond to usage on the plateform after 2015. The current usage metrics is available 48-96 hours after online publication and is updated daily on week days.
Initial download of the metrics may take a while.