Fig. 3
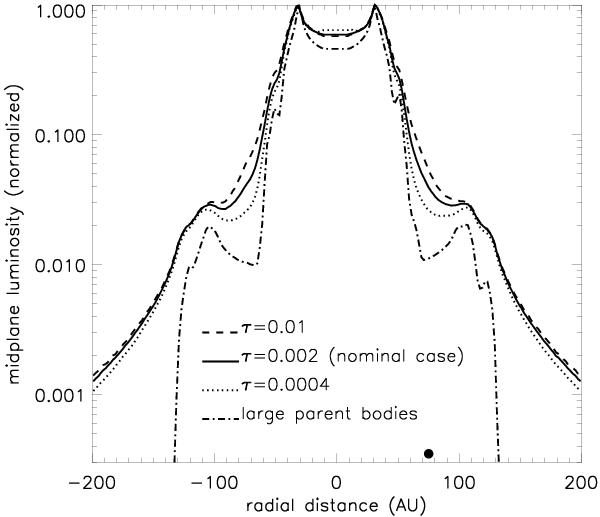
Synthetic midplane luminosity profiles for a disc seen edge-on, in scattered light, for the standard μ = 2 × 10⁻³ and ep = 0 case and for different values of the disc’s average optical depth (i.e., collisional activity). The shown profiles correspond to a cut along the X axis when the planet passes at its maximum elongation along this axis (the planet’s location is marked by a black circle). Profiles are computed assuming a grey scattering function. The profile for the large parent bodies is directly derived from the PB runs presented in Sect. 3.1.
Current usage metrics show cumulative count of Article Views (full-text article views including HTML views, PDF and ePub downloads, according to the available data) and Abstracts Views on Vision4Press platform.
Data correspond to usage on the plateform after 2015. The current usage metrics is available 48-96 hours after online publication and is updated daily on week days.
Initial download of the metrics may take a while.