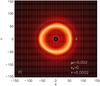
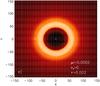
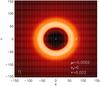
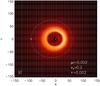
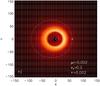
Fig. 10
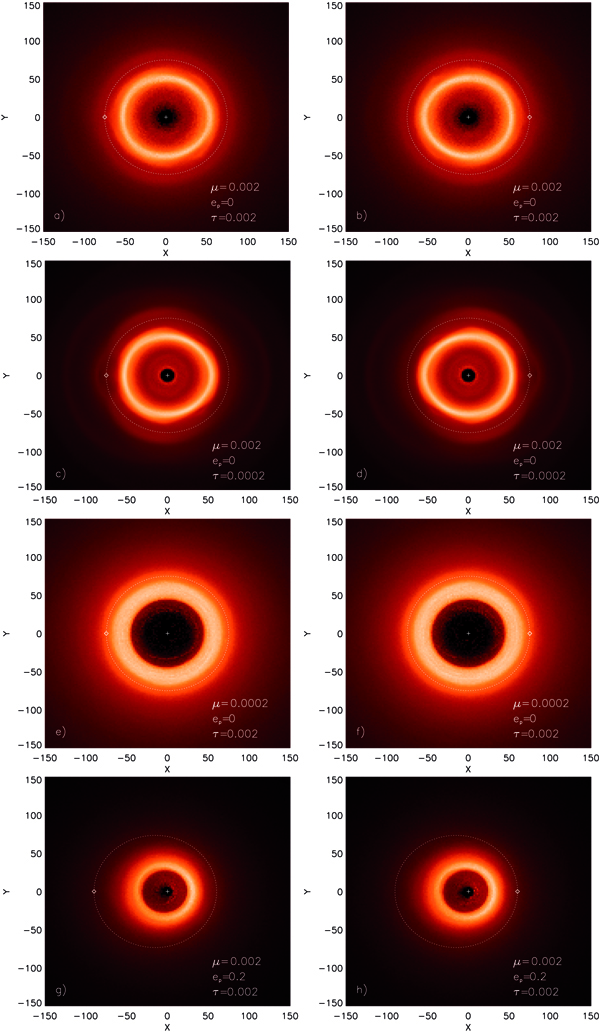
Inner ring/outer planet: head-on synthetic images in scattered light, at steady state, for four different set ups. The graphs on the left hand side show the disc profile when the planet passes at apoastron, and the graphs on the right hand side correspond to periastron passages. The dotted curve shows the planetary orbit. An animated version of these graphs is available in the electronic edition of the journal.
Current usage metrics show cumulative count of Article Views (full-text article views including HTML views, PDF and ePub downloads, according to the available data) and Abstracts Views on Vision4Press platform.
Data correspond to usage on the plateform after 2015. The current usage metrics is available 48-96 hours after online publication and is updated daily on week days.
Initial download of the metrics may take a while.