Free Access
Fig. 8
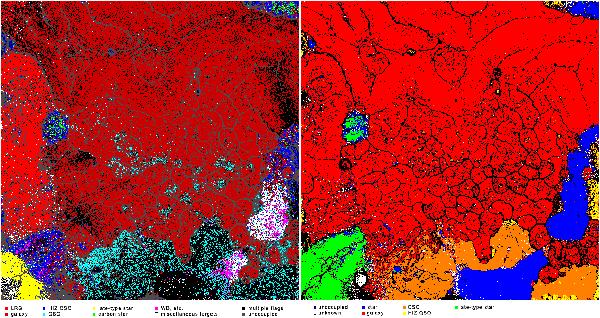
The same SOM as in Fig. 7, but with colour coding representing the SDSS primary target selection flag (left) and the classification parameter specClass resulting from the spectroscopic pipeline (right).
Current usage metrics show cumulative count of Article Views (full-text article views including HTML views, PDF and ePub downloads, according to the available data) and Abstracts Views on Vision4Press platform.
Data correspond to usage on the plateform after 2015. The current usage metrics is available 48-96 hours after online publication and is updated daily on week days.
Initial download of the metrics may take a while.