Fig. 5
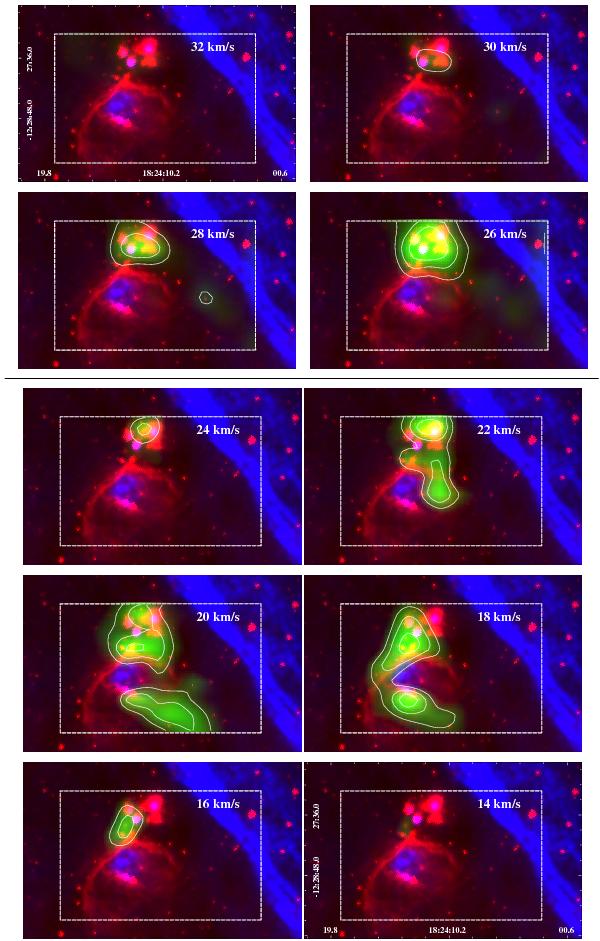
Integrated velocity channel maps of the 12CO J = 3–2 emission every 2 km s-1 (in green). As in previous figures, is shown the IRAC emission at 8 μm in red and the radio continuum emission at 20 cm in blue. The contours levels in the upper panels (from 32 to 26 km s-1) are 1.8, 3.6, and 7.0 K km s-1, while the contours levels in the bottom panels (from 24 to 14 km s-1) are 11.5, 15.0, and 19.5 K km s-1. The dashed rectangle shows the mapped region.
Current usage metrics show cumulative count of Article Views (full-text article views including HTML views, PDF and ePub downloads, according to the available data) and Abstracts Views on Vision4Press platform.
Data correspond to usage on the plateform after 2015. The current usage metrics is available 48-96 hours after online publication and is updated daily on week days.
Initial download of the metrics may take a while.