Free Access
Fig. 2
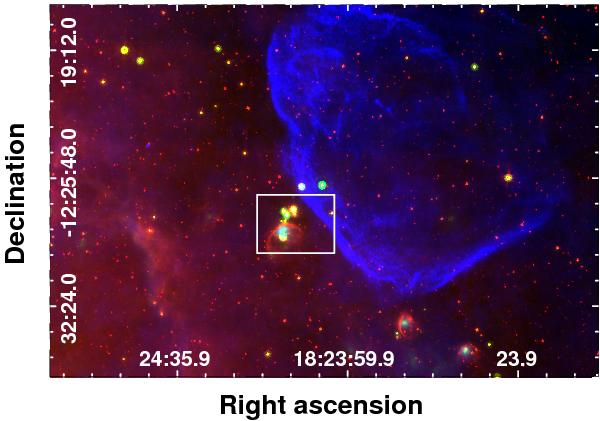
Three-color image of the SNR G18.8+0.3 and its surroundings. Again the radio continuum emission at 20 cm is presented in blue, the infrared bands at 8 μm and 24 μm are shown in red and green, respectively. The white rectangle shows the studied region.
Current usage metrics show cumulative count of Article Views (full-text article views including HTML views, PDF and ePub downloads, according to the available data) and Abstracts Views on Vision4Press platform.
Data correspond to usage on the plateform after 2015. The current usage metrics is available 48-96 hours after online publication and is updated daily on week days.
Initial download of the metrics may take a while.