Free Access
Fig. 1
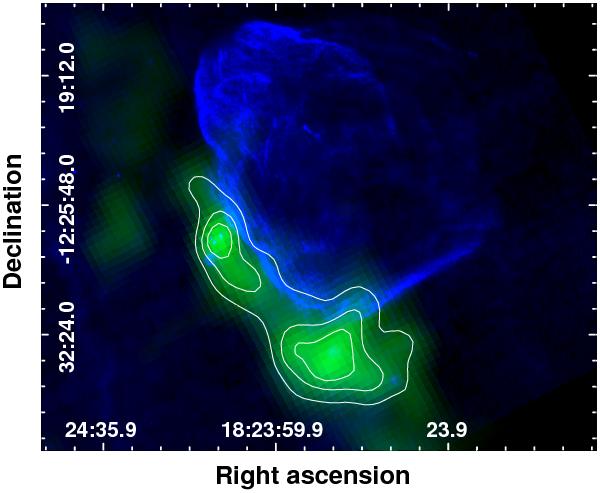
The SNR G18.8+0.3 radio continuum emission at 20 cm is displayed in blue and the 13CO J = 1–0 emission, extracted from the GRS (Simon et al. 2001), which was averaged between 17 and 22 km s-1 is presented in green with withe contours.
Current usage metrics show cumulative count of Article Views (full-text article views including HTML views, PDF and ePub downloads, according to the available data) and Abstracts Views on Vision4Press platform.
Data correspond to usage on the plateform after 2015. The current usage metrics is available 48-96 hours after online publication and is updated daily on week days.
Initial download of the metrics may take a while.